NSFsim Perspective on Disruptions in Tokamaks — Part II: Simulations for DTT
Part II: Simulations for DTT
The DTT facility at a glance
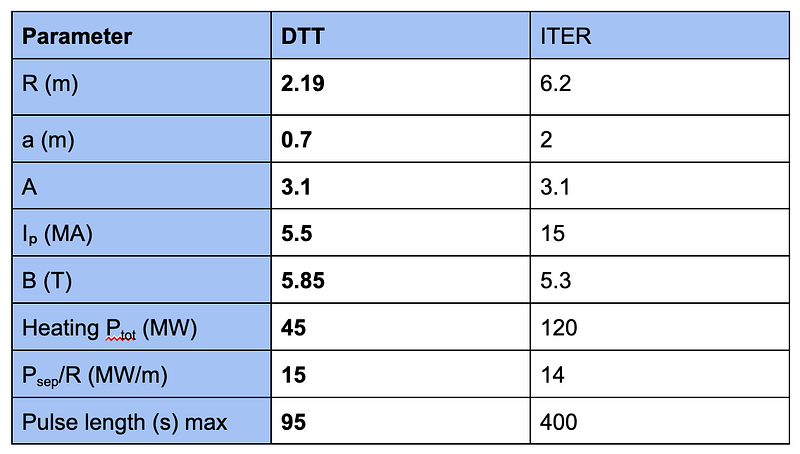
Divertor Tokamak Test facility (DTT) [1] is a medium-size, high-field tokamak purpose-built to tackle the problem of heat and particle exhaust (Fig. 1, Table 1). It is being developed by a consortium led by ENEA and ENI and including Italian research institutions and universities; it is being built in Frascati ENEA Research Center. Its design allows testing of different divertor concepts and validates SOL simulation under ITER and DEMO relevant power flow conditions. Thanks to flexible design, the machine can accommodate single-null, double-null, X-divertor, snowflake, and negative-triangularity scenarios.

The DTT research plan includes 3 phases [2]:
- High‑level commissioning & testing divertor modules with reduced plasma current (~2–3 MA) and initially half toroidal field to enable 2nd‑harmonic ECRH coupling. Auxiliary plasma heating with 14.5 MW of ECRH plus 3 MW of ICRH.
- Exploit the divertor configurations at higher power flux with an additional 9.5 MW of NNBI.
- Full-scale tests with 29 MW of ECRH plus 6 MW of ICRH, 9.5 MW of NNBI.
Disruptions at DTT
Disruptions are violent events that abruptly terminate a tokamak discharge and, if unmitigated, can damage in-vessel components and stress the vessel and coils (see our blog Part I: Physics Basis). DTT will operate with high B and Iₚ, utilising full-tungsten PFCs and ITER-relevant power densities. Therefore, the high thermal and electromagnetic loads during disruptions should be considered during machine design. The mechanical design of the first wall, vacuum vessel, and magnet supports is sized to withstand ~1000 disruptions at top performance (Iₚ = 5.5 MA; 45 MW injected). That number derives from experience on large metal‑wall tokamaks (JET, ASDEX Upgrade, DIII‑D, etc.). It uses a 30% overall disruptivity assumption — counting minor + mitigated events — with unmitigated full‑power events capped at ~20% of that total. For design checks, CQ durations of 4 ms (fast) and 40 ms (slow) were used for load assessment. The disruption mitigation system is under discussion and could be based on shattered pellet injection [3]. This will include two (optionally four) multi-barrel SPIs in toroidally opposite upper-oblique ports. In addition to this, MGI is considered for early operation.
DTT’s design team couples MAXFEA (free-boundary disruption/VDE time evolution) with ANSYS (3-D EM/structural response) [4] for disruption analysis [5]. A representative downward slow VDE shows a vertical force peak ≈ 10 MN (eddy + halo) and a stress hot-spot near the pedestal–outer-vessel connection, which drove local reinforcements. Toroidal peaking of halo forces has also been explored to capture worst-case local effects. Present studies inject global halo currents into ANSYS with assumed in/out locations and TPFs. Simulation of time-dependent halo paths and local peaking around ports, ribs, and supports is still required. It is also necessary to ensure that plasma evolution, halo formation, and load localization are simulated with consistent physics assumptions. DTT’s RE loads should be well below ITER’s (smaller device, lower avalanche gain) [3]. Relative to JET/ASDEX Upgrade, the level of RE formation isn’t completely clear yet. A EUROfusion survey shows RE generation increases with higher pre-disruption Iₚ (and exhibits trends with Bₜ), consistent with stronger avalanche drive at higher current [6]. At the same time, AUG’s full-tungsten wall has reported some cases with no RE generation (in SPI mitigated disruptions), illustrating how tungsten wall and CQ dynamics can suppress REs in practice [7].
Why add NSFsim simulations
NSFsim’s numerical core inherits the free-boundary Grad-Shafranov solver and coupled circuit model pioneered in the DINA code [8]. The rich legacy of DINA disruption studies includes ITER [7], ASDEX Upgrade [10], TCV [11], JT60-U [12], and HL-2M [13]. NSFsim can natively couple the plasma equilibrium to PF circuits, the resistive wall, and feedback controllers. NSFsim disruption simulations leverage emulation of control system failures and the exact PF waveforms. It allows performing realistic “controller-coupled disruption” studies. The obtained plasma evolution can be used as an input to 3-D EM/structural models.
NSFsim allows several options to trigger disruption in the simulation. We can let the plasma “free-evolve” (numerical error builds like a real MHD instability), or apply an artificial thermal quench (TQ). To reproduce loss-of-control after TQ, we fix PF-coil currents and disable active control. Alternatively, we can trigger a disruption by steering q95 across a stability limit (e.g., below ~2). An array of conductive toroidal filaments represents the VV, so we can capture eddy currents (poloidal and toroidal components) and the EM response during all disruption phases (TQ, VDE, CQ).
NSFsim results for DTT
We demonstrate NSFsim on DTT (Fig. 2). The goal is to provide input for force assessment (e.g., with ANSYS) and control-system requirements (how far/fast the column moves and for how long during a disruption).
The simulation provides dynamics during thermal quench, vertical displacement, and the current quench. It includes poloidal and toroidal eddy currents and their distribution along the vacuum vessel cross-section. The model also provides halo currents. Halo currents appear during the destruction of closed magnetic surfaces and depend on the evolution of the core Ip loss. The evolution of toroidal and poloidal plasma current profiles and their transfer to the halo region are simulated. The halo region poloidal extension is based on a scaling from ASDEX [14, 15]. The internal plasma inductance throughout the disruption process is available. To ensure fast calculation capabilities without losing the critical information, the time step for plasma current simulation is not uniform. It gets shortened at the disruption start (1 ms before TQ, 0.1 ms in the vicinity of TQ, and 0.05 ms after it). NSFsim can capture typical disruption features that are involved in disruption prediction, PCS, and force assessment.
A major disruption was simulated for DTT (Fig.3). TQ is artificially induced at 4 ms. Slight radial and vertical movement is observed already before TQ (starts at ~1 ms). The pre-quench phase also includes a slight drop in Ip. TQ results in characteristic Ip spike through profile restructuration followed by current quench. This is where halo currents start to arise. While in principle, NSFsim is capable of calculating halo current transfer to the vacuum vessel, this feature is not implemented yet as it requires a detailed 3D analysis and model of the vacuum vessel and its connection points to the limiter. However, the time evolution of poloidal and toroidal halo currents may serve as an input for other 3D codes (e.g., ANSYS).

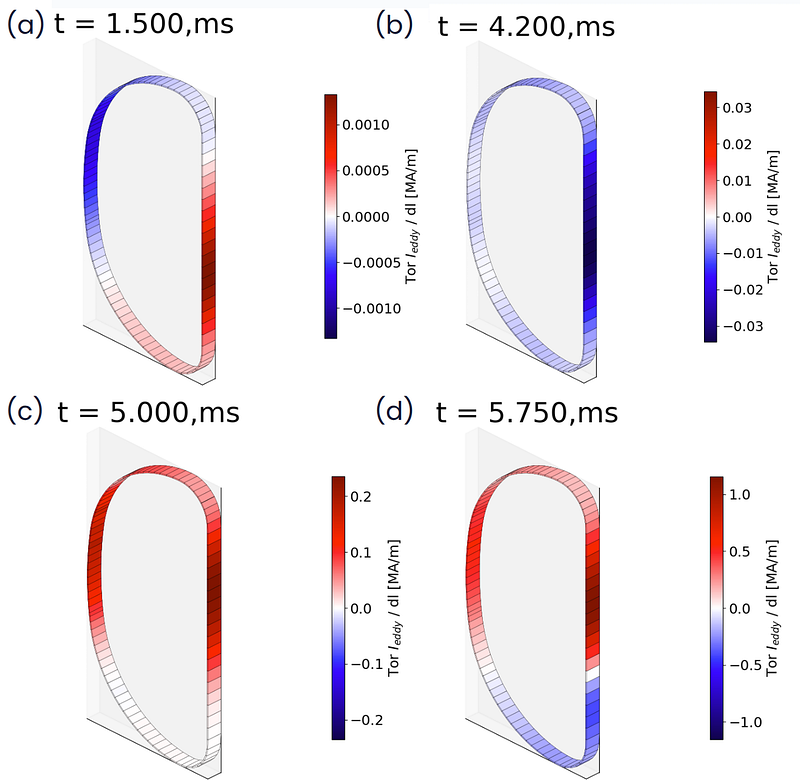
Toroidal vessel current distribution along the vacuum vessel cross-section is presented in Figs. 4 and 5. Small (up to 1.5 kA/m) dipole-like toroidal eddy currents are arising on HFS and LFS even before TQ as a response to slight plasma displacement (both in R and Z directions) (Fig. 4a). As the plasma area grows right after TQ (4.2 ms), counter-Ip current is induced throughout the whole VV cross-section to prevent expansion (Fig. 4b). At the beginning of the CQ (e.g., 5 ms), plasma movement is more pronounced. It induces dipole-like eddy currents in the opposite parts of the vessel. However, CQ induces co-Ip (positive) eddy currents in the lower HFS area, therefore almost cancelling out the negative part from the dipole-like currents (Fig. 4c). At 5.7 ms, plasma movement is accelerated by the CQ, leading to stronger dipole-like eddy currents (positive on higher LFS and negative at lower HFS). While CQ still induces co-Ip (positive) eddy currents in the lower HFS area, they are not strong enough to cancel the negative part from the dipole-like currents (Fig. 4d).
DTT will operate in a regime where credible disruption scenarios must directly inform mechanical load assessments. Our results show that NSFsim generates controller-aware disruption evolutions (TQ, CQ, VDE) with time-resolved eddy/halo currents suitable for downstream 3D EM and structural analysis. MAXFEA+ANSYS provides conservative load envelopes from prescribed free-boundary evolution, fixed kinetic parameters, and a user-set halo poloidal extension. NSFsim generates self-consistently evolving plasma (including kinetic parameters) that couples with PF circuits. NSFsim tracks a halo region of dynamic width that expands according to toroidal-flux conservation. Therefore, NSFsim complements the current MAXFEA+ANSYS workflow for design checks and supports the development of a reliable plasma control system.
Next Step Fusion is a supply chain company supporting tokamak developers in the design, simulation, optimization, control, and operation of their devices through integrated modeling and AI/ML-enabled solutions.
We invite you to be part of this groundbreaking journey!
Follow our blog on Medium, subscribe to our LinkedIn for regular updates, watch our videos on YouTube, or reach out to us directly to discuss potential collaborations.
References
[1] DTT website
[2] F. Crisanti et al, Physics basis for the divertor tokamak test facility
[3] E. Nardon et al, MHD, Disruptions and Control (MDC), DTT Research Plan team meeting
[4] R. Lombroni et al, Using MAXFEA code in combination with ANSYS APDL for the simulation of plasma disruption events on EU DEMO
[5] F. Giorgetti et al, Vertical displacement events analysis using MAXFEA code in combination with ANSYS APDL in the final design stage of the DTT vacuum vessel
[6] V Plyusnin et al. Comparison of Runaway Electron Generation Parameters in Small, Medium-sized and Large Tokamaks — A Survey of Experiments in COMPASS, TCV, ASDEX-Upgrade and JET
[7] P. Halldestam et al, Reduced kinetic modelling of shattered pellet injection in ASDEX Upgrade
[8] R.R. Khayrutdinov et al, Studies of Plasma Equilibrium and Transport in a Tokamak Fusion Device with the Inverse-Variable Technique
[9] M. Sugihara et al, Analysis of Disruption Scenarios and Their Possible Mitigation in ITER
[10] V.E. Lukash et al, Validation of halo current model with DINA code against ASDEX Upgrade disruption shots
[11] J-Y Favez et al, Comparing TCV experimental VDE responses with DINA code simulations
[12] V. Lukash et al, Validation of halo current model with DINA code against JT-60U disruption shots
[13] Lei Xue et al, Simulation of Plasma Disruptions for HL-2M with the DINA Code
[14] G. Pautasso et al, The halo current in ASDEX Upgrade
[15] V.E. Lukash et al, Validation of halo current model with DINA code against ASDEX Upgrade disruption shots